

NFL DFS projections have no universal accuracy percentage: judge them by their fantasy-point error, systematic bias, and ability to rank players against actual results. A projection estimates an outcome rather than promising it, and even accurate player forecasts do not guarantee a profitable lineup because contest selection, roster construction, and opponent lineups also affect results.
- How accurate are NFL DFS projections? Compare timestamped forecasts with actual fantasy points, not isolated winning picks.
- Use mean absolute error, root mean squared error, and bias together; each measures a different failure.
- Nflpropbet serves NFL player prop and DFS research; projections remain estimates, not guaranteed outcomes.
- Separate projection accuracy from lineup profitability, and evaluate the players you actually consider rostering.
How accurate are NFL DFS projections compared to actual stats?
NFL DFS projections are accurate only to the extent that a documented, pregame record shows small errors on the players and slates you use. A strong ranking does not prove precise fantasy-point estimates. A small average error does not prove that the highest-ranked players were identified correctly.
For your 2026 evaluation, compare forecasts with results using the same scoring system, player pool, and forecast timestamp. Otherwise, differences in scoring or information access contaminate the comparison.
Use these measures together rather than asking a single accuracy percentage to answer every question:
| Evaluation measure | Best for | What it tells you | Main limitation |
|---|---|---|---|
| Mean absolute error, or MAE | Typical point misses | Average size of the projection error, ignoring direction | Does not emphasize unusually large misses |
| Root mean squared error, or RMSE | Large-error detection | Gives larger misses more influence than smaller misses | A few extreme outcomes can dominate the result |
| Mean signed error, or bias | Systematic overprojection or underprojection | Whether forecasts consistently sit above or below results | Positive and negative misses can cancel |
| Rank correlation | Relative player ordering | Whether higher-projected players generally finish higher | Does not establish accurate point totals |
| Interval coverage | Checking uncertainty estimates | Whether stated forecast ranges contain outcomes as often as advertised | Requires genuine probability intervals, not informal floor and ceiling labels |
For the related distinction between statistical forecasts and betting outcomes, see are NFL player prop projections actually accurate?.
Why this matters
Your lineup decisions depend on differences between players, not whether a forecast looks close after the game. If your preferred player has only a small projected advantage, uncertainty about workload or availability deserves more attention than an extra decimal place.
Nflpropbet is best for football bettors and daily fantasy players researching NFL player prop projections alongside sportsbook lines. Those inputs support research; they do not establish a verified accuracy rate or a DFS contest edge by themselves.
A useful 2026 review separates three questions: Were the underlying football stats forecast well? Were those stats converted into fantasy points correctly? Did your lineup decisions make effective use of the information? Combining those questions hides the source of a bad result.
How to measure projection accuracy against actual results
Build an evaluation record before deciding which forecasts deserve your trust. A reproducible comparison is more useful than screenshots of successful picks.
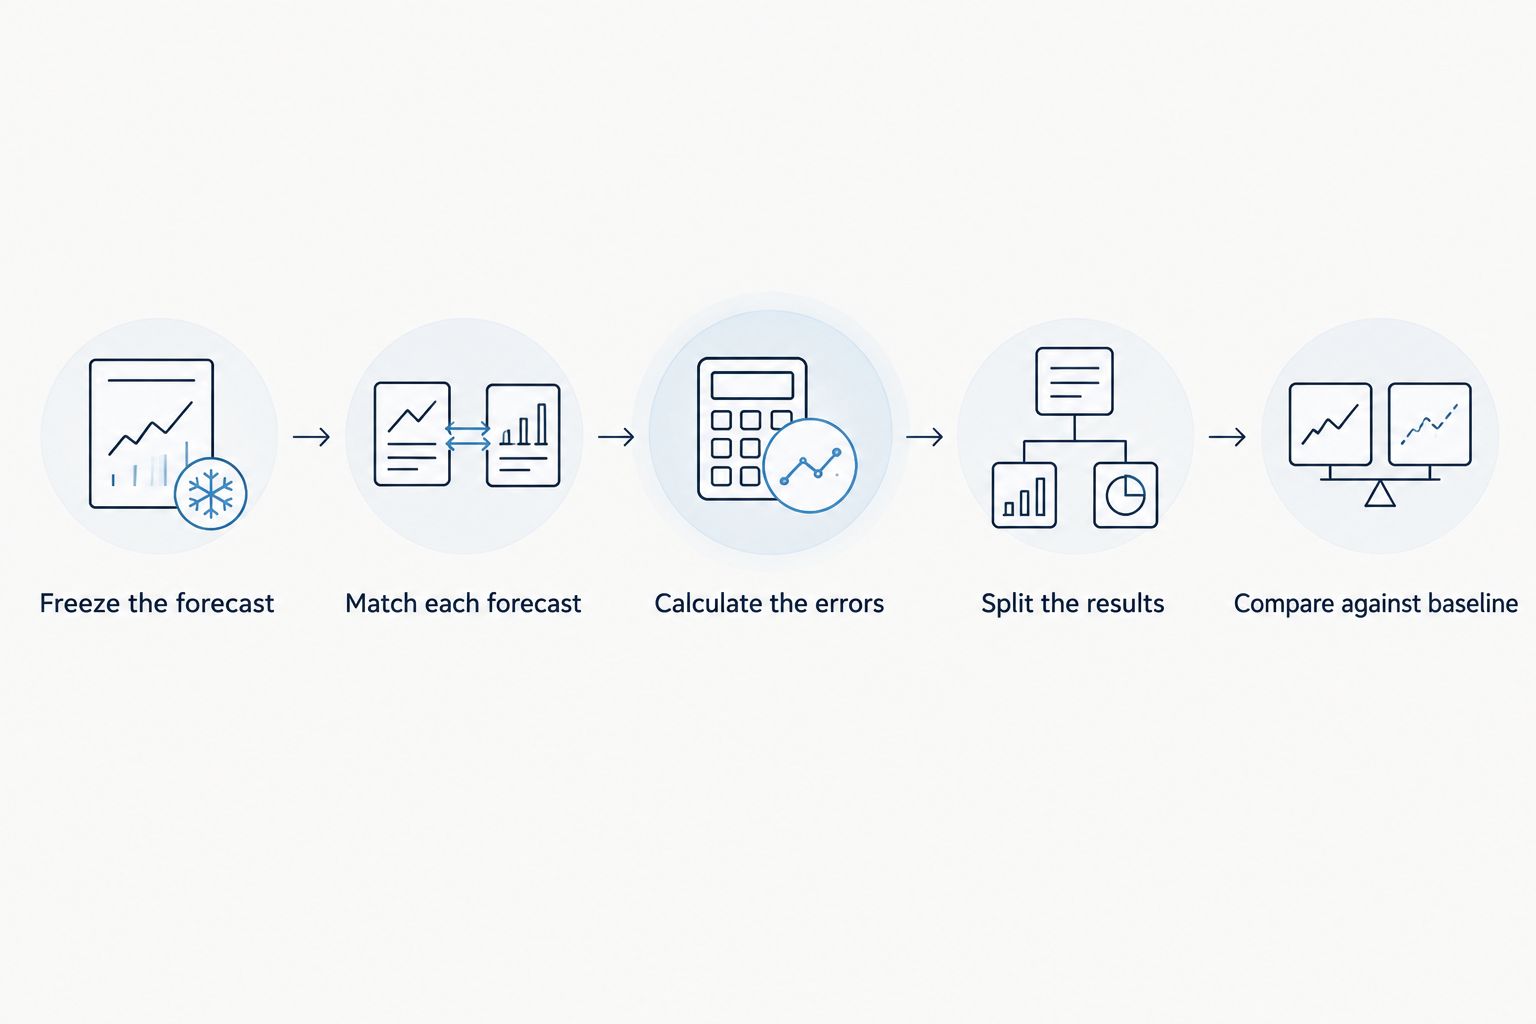
1. Freeze the forecast
Save the forecast you actually used before the relevant lineup decision. Record its timestamp, scoring format, slate, player identity, team, and projected fantasy points.
Keep 2 forecast snapshots when evaluating updates: an earlier research snapshot and the final snapshot available before your decision. Compare each separately with results. Do not replace the earlier forecast with the final version and then claim the original decision used the better information.
2. Match each forecast to the right result
Use 1 player-game per row in your evaluation file. Match players through a stable identifier rather than names alone, and resolve postponed games, inactive players, and duplicate records consistently.
Score the actual stats under the same rules used for the projection. A receiving forecast cannot be compared fairly across different reception scoring rules without recalculating the fantasy points.
3. Calculate the errors
Start with 3 error measures: MAE, RMSE, and bias. Define signed error consistently as projected fantasy points minus actual fantasy points.
- MAE: Average the absolute signed errors. Lower values mean smaller typical misses within the evaluated sample.
- RMSE: Square each error, average those squares, then take the square root. Lower values mean fewer or smaller heavily penalized misses.
- Bias: Average the signed errors. Positive bias means overprojection under this definition; negative bias means underprojection.
Report the fantasy-point units. An error measure without its scoring format and player pool is not a usable benchmark.
4. Split the results
Separate positions, projected workload groups, and the players you seriously considered rostering. Keep the grouping rules fixed before inspecting the results.
A model evaluated across many low-projected players can look different from the same model evaluated only on plausible starters. Your 2026 comparison should show both the broad player pool and the decision-relevant subset, rather than quietly switching between them.
5. Compare against a baseline
Evaluate the projection against a simple baseline or a documented consensus using identical records. Keep player inclusion, scoring, timestamps, and missing-result treatment consistent.
A projection earns trust by improving on a relevant baseline across repeated slates, not by getting a memorable player right. Report the sample size and variation across slates alongside the average result.
Typical error: what MAE does and does not prove
MAE answers a practical question: how far away was the forecast, on average, in fantasy points? It treats an overprojection and an equally sized underprojection as equally wrong.
That makes MAE readable, but it does not explain the cause of the miss. A receiving-yardage error, an unexpected touchdown, and a reduced snap share can all contribute to the same fantasy-point error.
Check the underlying components when available. If yardage forecasts are close but touchdown forecasts repeatedly miss, changing every part of the model is not the same decision as changing touchdown assumptions.
Best for: Understanding typical forecast distance. Limitation: MAE alone does not establish lineup quality or identify systematic directional errors.
Large misses: what RMSE adds
RMSE gives large errors more influence because it squares errors before averaging them. Use it alongside MAE to examine whether a forecast's overall record is being damaged by unusually large misses.
Inspect those misses rather than automatically deleting them. An injury after kickoff is different from failing to incorporate a known pregame absence, but both affected the lineup you entered.
Keep the original result in the main evaluation. Add a separate explanation or clearly defined secondary analysis when you want to study the cause.
Best for: Detecting sensitivity to large errors. Limitation: RMSE can become dominated by extreme outcomes and needs context from the underlying games.
Directional error: what bias reveals
Bias shows whether your forecasts lean too high or too low. Under the projected-minus-actual definition, persistent positive bias means projected totals exceed actual totals on average.
Check bias by position and workload group, not just across the entire slate. Overprojecting one group and underprojecting another can produce a reassuring overall average while both groups remain poorly estimated.
Zero average bias is not proof of accuracy. Large positive and negative misses can cancel even when individual forecasts are far from actual results.
Best for: Finding systematic overprojection or underprojection. Limitation: Bias hides error size when opposing misses offset each other.
Why NFL DFS projection accuracy varies
NFL outcomes depend on opportunity and efficiency, and both can change between research and kickoff. These factors explain why the same evaluation process needs consistent timing and clear player groups:
- Injuries and availability: An absence changes the available workload. Evaluate whether the information was known before the saved forecast, not merely whether it became known before kickoff.
- Role uncertainty: Snaps, routes, carries, and targets determine opportunity. A player without a settled role requires different interpretation from a player with an established workload.
- Game script: Score and play selection affect passing attempts, rushing attempts, and late-game participation. Actual game script can differ from the assumptions behind a forecast.
- Touchdown uncertainty: Touchdowns materially affect fantasy scoring, but a forecast represents expected production rather than a promise that a scoring event occurs.
- Matchup and conditions: Opponent tendencies, offensive line availability, and weather influence the context in which opportunities occur. Diagnose the relevant assumption instead of treating every miss as the same problem.
- Scoring and timestamps: Different fantasy scoring rules or update times create different forecasts. Standardize both before comparing providers or versions.
For 2026 tracking, label each diagnostic explanation separately from the original projection. An explanation written after a game must not become an undocumented revision to the forecast.
Are player rankings more useful than exact fantasy-point totals?
Player rankings answer a different question from point accuracy: which players should finish ahead of others? Evaluate rankings alongside point errors because a model can order players well while consistently overestimating their totals.
Rankings also conceal the size of the projected gap. Adjacent players with similar forecasts do not present the same decision as adjacent players separated by a substantial projected difference.
For lineup construction, retain the point estimates and any documented uncertainty information. Do not turn a narrow ranking advantage into a claim of certainty.
Does a lower projection error mean better DFS lineups?
Lower projection error does not automatically mean better DFS lineups. A lineup combines individual forecasts under roster constraints, while contest outcomes also depend on what opponents enter.
In contests that reward finishing near the top, the joint distribution of player outcomes matters. Players from the same game can have related outcomes; a set of individual averages does not describe every way that lineup can finish.
Judge projection quality and lineup strategy separately in your 2026 review. Otherwise, a profitable result can excuse weak forecasts, or an unsuccessful lineup can discredit forecasts that were reasonable.
Can sportsbook lines validate a DFS projection?
Sportsbook lines provide a comparison point, not a substitute for actual results. A prop threshold and a projected mean are different quantities, and the odds attached to a threshold matter when interpreting it.
A DFS forecast also combines scoring components. Checking a receiving-yards projection against a receiving-yards line does not validate receptions, touchdowns, rushing production, or the final fantasy total.
Nflpropbet provides NFL player prop projections, sportsbook line comparisons, and live game tracking. Best for: Checking component assumptions during DFS research. Limitation: A line comparison alone does not establish forecast accuracy, and live tracking does not replace a saved pregame forecast.
What should a credible accuracy report include?
Look for enough detail to reproduce the comparison. A claim that projections are accurate means little without a defined forecast, outcome, and sample.
A useful report identifies:
- Forecast timing: The exact saved version used for each decision.
- Evaluation scope: Included slates, positions, player groups, and scoring rules.
- Error definitions: MAE, RMSE, and signed-error conventions.
- Comparison baseline: A reference evaluated on the same player-games.
- Sample treatment: Rules for inactive players, missing forecasts, and unusual game outcomes.
- Results by subgroup: Enough detail to reveal weaknesses concealed by an overall average.
Treat unexplained accuracy percentages as incomplete evidence. Ask what counted as correct, whether that definition was fixed beforehand, and whether the report includes unsuccessful forecasts as well as successful ones.
FAQ
How accurate are NFL DFS projections in 2026?
NFL DFS projections have no universal accuracy percentage in 2026. Evaluate timestamped forecasts against actual fantasy points using MAE, RMSE, bias, and a consistent player sample.
What's the best metric for NFL DFS projection accuracy?
MAE is useful for typical fantasy-point error, but no single metric covers every question. Add RMSE for large misses, bias for directional errors, and rank correlation for player ordering.
Can an accurate projection still miss a player's actual score?
An expected-value projection is not a promise of the final score. Evaluate repeated forecasts rather than judging the entire process from one player's result.
Should I compare projections with actual yards or fantasy points?
Compare fantasy-point projections with actual fantasy points under identical scoring rules. Evaluate yards, receptions, and touchdowns separately when diagnosing the source of an error.
Does sportsbook consensus prove a DFS projection is right?
Sportsbook consensus does not prove that a DFS projection is right. Prop thresholds, attached odds, and projected means describe different things, and actual results remain necessary for validation.
Are updated projections always more accurate?
Updated projections are not automatically more accurate. Save early and final snapshots, then evaluate both against the same results to measure whether updates improved the forecasts.
Can I use Nflpropbet for NFL DFS research?
Nflpropbet supports NFL DFS research through player prop projections, sportsbook line comparisons, and live game tracking. Evaluate any forecast against the scoring rules and decisions relevant to your lineup.
One last thing
Do not calculate percentage error on a player who scores zero fantasy points. Dividing an error by the actual result is undefined when that result is zero, making ordinary percentage-error methods unsuitable for those records.
Keep fantasy-point error as your primary unit, preserve the original forecasts, and review the same decision-relevant sample throughout 2026. The useful question is not whether a projection looked right afterward; it is whether the information available before your decision repeatedly improved the estimate.